To the trenches!
Clearly, we need to find out how to decrypt the metadata file. To do this, we first need to find out where in the code the decryption occurs.
There are various ways of doing this, and you can certainly just trace the binary using static analysis in a disassembler,
but there is an easier way.
ProcMon
is an excellent piece of software to have in your arsenal. It allows you to – among other things – capture Windows API calls occurring
in a target process and produce a stack trace from the call site. We’ll use this to find out where in Honkai Impact global-metadata.dat
is accessed and then examine the code.
When ProcMon first loads, you’ll want to clear the default filters and create a new filter as follows:
This instructs ProcMon to capture all file accesses to global-metadata.dat coming from BH3.exe,
which is Honkai Impact’s root process. Open C:\Program Files\Honkai Impact 3rd\Games in file explorer, double-click on BH3.exe,
wait for the epilepsy seizure warning to appear then press Alt+F4 to kill the process. In ProcMon, you’ll see something like this:
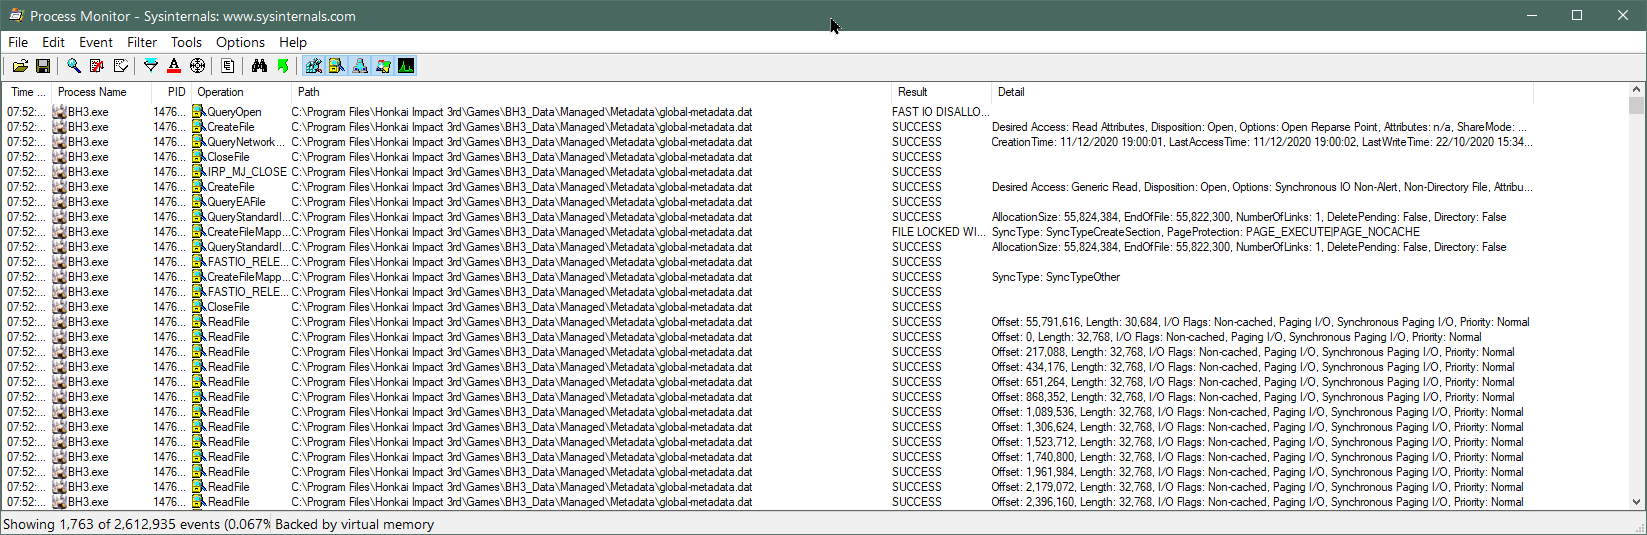
Now we can see all of the API calls made using global-metadata.dat‘s file handle. Don’t be confused by the calls to
CreateFile
– this function can be used not just to create files but also to open existing files, which is the case here. We note calls to
CreateFileMapping,
which maps a file to a region of unallocated virtual memory without actually loading it from storage. When the application attempts to read from one of these memory addresses,
the Windows kernel will read the corresponding portion of the file if necessary – this is called
demand paging
and reduces memory consumption at the expense of requiring an open file handle for however long the file contents are needed.
It also means the file may be read out-of-order.
Note that the kernel will read the file in blocks – not just specifically the requested bytes – as an optimization.
As you can see above, the page size is 32KB (each read has a length of 32,768 bytes). With this in mind, notice how the
application reads the very end of the file first: the first call to ReadFile is at offset 55,791,616 (0x3535000)
and has a length of 30,684 bytes (less than 32KB because the file size is not exactly divisible by 32KB); taking us to 0x353C7DC
or the length of the file. The fact the kernel reads from 0x3535000 doesn’t mean the application requested precisely these bytes.
It may have just wanted a portion of the data, but the kernel will always read in page-sized blocks when using demand paging. Recall that there
is a blob of 0x4000 bytes of unknown data at the end of the file, beyond the metadata tables. We know that global-metadata.dat
is usually read from the start, because the header at the beginning of the file contains the information needed to find everything else in the file.
Reading the end of the file first is therefore highly suspicious, and lends credence to the theory that this data is needed first to be used in some
kind of decryption function.
Let’s double-click on the ReadFile
event where the data is read from offset zero – ie. the start of the file – and select the Stack tab to see the stack trace (the most recent calls appear first):
Native\UserAssembly.dll is what is normally called GameAssembly.dll in the Unity app’s root folder,
but it has been moved and renamed by the developers here.
The first thing to note is that you should ignore the function names shown in the Location column: these assume the files
have symbols available, so while they will be accurate for Windows DLLs like ntoskrnl.exe, they will be incorrect
for our game. ProcMon just looks through the export table to find the function with the nearest starting address before the
call site and assumes that is the name of the function. It is easy to tell the function names are wrong because they have
massive offsets into the function start addresses: while UnityMain + 0x36 is almost certainly an instruction
0x36 bytes into UnityMain, we very much doubt that il2cpp_value_box (which converts
a value type into a boxed reference type) is either 0x589113F bytes long, or would be playing any role in loading a file.
This call is really being made from another, unexported function. The good news is that the absolute call addresses in the
Address column will be correct in all cases, so we’ll focus on these.
All of the kernel mode calls (those prefixed by a K in the Frame column) can be ignored – these all basically just deal
with the file read (or other API call) requested by the application and aren’t important to us. The relevant call is the
final one made by our application, which is at address 0x7FFF4E2C385 in UnityPlayer.dll. This
is the instruction which actually triggers the kernel to read data from the underlying storage.
In a normal Unity application, global-metadata.dat is read exclusively by the main game binary and not
touched by UnityPlayer.dll, so the fact that UserAssembly.dll here calls back into UnityPlayer.dll
to perform a read is suspicious. It may indicate custom decryption code added to UnityPlayer.dll.
We now want to trace through the code to see exactly what is happening, so we load up both UnityPlayer.dll
and UserAssembly.dll into IDA. We also want to compare the shipped UnityPlayer.dll with one
from a blank Unity project. We can determine the game’s Unity version by simply looking at the EXE’s file properties,
or by loading an asset file into a hex editor and looking at the version string at the top. Honkai Impact 3rd uses Unity 2017.4.18f1,
which in itself is noteworthy because Windows standalone IL2CPP support was not introduced until Unity 2018.1.0 –
there is a considerable amount of customization going on here. We need to work with the closest version we can to
minimize the amount of code changes in UnityPlayer.dll, so we
install Unity 2018.1.0 via Unity Hub,
create a blank 3D template project, set the scripting backend to IL2CPP, the architecture to x64, enable PDB generation so that we
can see all of the symbols (function names and so on) when we disassemble our own DLL, but disable ‘Development build’ so that it
doesn’t emit lots of extra debugging code in every function that will just confuse us, leave everything else at their default
settings in the hope that the developers did the same, click Build, wait a while and then open our freshly-baked UnityPlayer.dll
into IDA as well. When loading three binaries into IDA, strong coffee is advised.
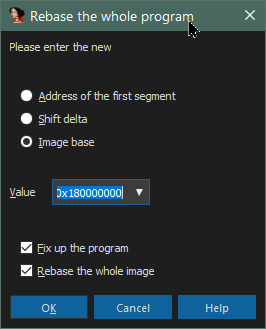
DLLs have a preferred image base address – commonly but not always 0x180000000 – but they are usually allocated
at a non-preferred base address in memory. IDA will initially display virtual addresses relative to the DLL’s preferred image base.
For example, if the preferred image base of UserAssembly.dll is 0x180000000 and the offset of the il2cpp_init
function from the image base is 0x123456 bytes, IDA will display this function at virtual address 0x180123456.
However, if it is loaded in memory at 0x200000000 when actually executed, the address of il2cpp_init
shown in ProcMon’s stack trace will be 0x200123456. To make the stack trace line up with the disassembly, we need
to fix this somehow. There are two options: subtract the difference between preferred and actual image bases from every address
with a calculator while moving around in the file, or change the image base address of the file in IDA. The latter is much less
error-prone, so we’ll do that. This step is called rebasing. To do it, choose Edit -> Segments -> Rebase program…
from the IDA menu, and set the options as follows:
The Process tab of the event in ProcMon helpfully shows us the loaded image base of every DLL used by the application:
In the case above, we’ll rebase UserAssembly.dll to 0x7FFF3C520000 and UnityPlayer.dll
to 0x7FFF4E280000. You can also do this when you first load the files by ticking Manual load
and accepting all the defaults on the many dialog boxes that appear besides the image base address, which is the first dialog.
If you live near a beach, now is a good time to take a midnight swim, or perhaps – as I did – just stare wistfully out
of the window contemplating whether the rebase or the heat death of the Universe will win. It’s coming.
Tip: It can be hard to understand the output of ProcMon without an anchor reference.
For IL2CPP games, creating a blank Unity project and
watching how it behaves in ProcMon will give you an excellent baseline to help you spot sneaky changes in production code.
Tip: ProcMon captures millions of events every minute and consumes
large amounts of resources. Even when you have filters enabled, all events are still captured – just not displayed.
Close ProcMon as soon as you are finished using it – it will crash eventually if you don’t.